
Instagram Automation Metrics: What Should You Actually Measure?
Automation can send thousands of DMs, respond to comments, and handle customer questions while you sleep. But how do you know whether it is actually working?
A dashboard full of numbers can look impressive. You might see thousands of automated replies, hundreds of conversations, and a growing number of interactions—but activity does not always equal results.
If your automation generates 5,000 replies but only two qualified leads, something needs to change. The real question is not “How much did my automation do?” It is “What did my automation achieve?”
That is why businesses need to look beyond basic activity numbers and focus on metrics that connect Instagram automation to engagement, conversations, leads, and revenue.
Why Instagram Automation Metrics Matter
Without measurement, automation becomes a set-it-and-forget-it system. You create a workflow, turn it on, and assume it is doing its job—even though well-designed automation can still underperform.
Customers may not receive your DMs, automated responses may fail to earn replies, people may engage without clicking, or a workflow may generate conversations without turning them into leads.
Tracking the right metrics shows where the customer journey works and where it breaks. Think of Instagram automation as a funnel: Comment → DM → Conversation → Click → Lead → Customer.
Every stage gives you something meaningful to measure.
1. Automation Trigger Rate
The first metric to track is how often your automation actually gets triggered. Suppose a workflow sends a DM whenever someone comments “LINK.” If 500 people comment but only 300 trigger the automation, there is a gap.
Trigger rate helps you understand whether your automation rules capture the interactions you intended. A low rate may mean keyword rules are too restrictive or customers are using phrases you did not anticipate.
- Number of eligible comments
- Number of automation triggers
- Trigger rate
- Most frequently triggered keywords
2. DM Delivery Rate
Triggering a DM does not necessarily mean the customer received it successfully. That is why DM delivery rate matters.
For example, 1,000 automation triggers followed by 950 successful deliveries equals a 95% delivery rate. If delivery is significantly lower than expected, investigate workflow setup, platform limitations, and recipient eligibility.
The important distinction is between messages sent and messages successfully delivered. They are not always the same thing.
3. Response Time
Speed matters on Instagram. A customer asking “How much is this?” may be ready to buy right now, and waiting several hours for an answer can mean losing momentum.
Automation can reduce response time dramatically by replying as soon as the relevant trigger occurs.
The goal is not simply to make responses faster. It is to make sure customers receive the right response quickly.
- Average response time
- Median response time
- Time to first automated response
- Time to human handoff
4. Automated Response Rate
Automated response rate shows how much incoming conversation volume is handled automatically. If 2,000 interactions arrive, 1,400 are handled automatically, and 600 need human intervention, automation handled roughly 70%.
This reveals whether workflows actually reduce manual workload. But a higher automation rate is not automatically better: if the answers are incorrect, a 95% rate is not something to celebrate.
Quality matters more than volume.
5. Engagement Rate After Automation
Automation should not end the conversation. It should encourage the next action: Comment → Automated DM → Customer reply.
If an automated DM receives very few responses, the message may not be relevant, clear, or compelling enough. For example, 1,000 automated DMs followed by 250 customer replies produces a 25% response rate.
That shows whether automation is merely delivering messages or genuinely generating conversations.
- DM reply rate
- Comment engagement
- Conversation continuation rate
- CTA interaction
6. Click-Through Rate
If your automation includes a link, measure how many recipients click it. For example, 180 clicks from 1,000 delivered DMs produces an 18% click-through rate.
This helps evaluate CTA strength, message relevance, link placement, offer attractiveness, and audience intent.
When delivery is high but clicks are low, the automation may be working correctly while the message or offer needs improvement.
7. Lead Capture Rate
For businesses using Instagram to generate leads, lead capture rate is one of the most important metrics. If 5,000 comments create 2,000 conversations and 500 qualified leads, the comment-to-lead capture rate is 10%.
This tells you whether Instagram automation contributes to real business opportunities rather than simply generating engagement.
Define exactly what a lead means for your business before measuring it.
- Contact information captured
- Demo requested
- Consultation booked
- Product inquiry submitted
- Form completed
- Trial started
8. Conversion Rate
Leads are valuable; customers are better. If 500 qualified Instagram leads produce 75 customers, the lead-to-customer conversion rate is 15%.
Conversion rate also helps compare workflows. A product Reel may produce 300 leads and 30 customers for a 10% conversion rate; a giveaway may produce 500 leads and 15 customers for 3%; and a tutorial may produce 150 leads and 30 customers for 20%.
The tutorial generated fewer leads but just as many customers as the product Reel. That is more useful than simply saying the giveaway received the most comments.
9. Human Handoff Rate
Automation should not try to handle everything. Human handoff rate shows how often an automated workflow needs to pass a conversation to the team.
If 1,000 automated conversations lead to 120 escalations, the handoff rate is 12%. A high rate is not necessarily bad; the audience may be asking complex questions.
But if nearly every conversation needs intervention, the automation probably needs better rules, FAQs, or workflows. Track the conversation types being escalated most often to find those gaps.
10. Automation-Assisted Revenue
This is where Instagram automation becomes a business metric rather than just a marketing metric. Ask how much revenue can be attributed to conversations started or supported by automation.
For example: automation creates 500 qualified leads, which generate 80 purchases and ₹4,00,000 in attributed revenue. That gives you a much clearer picture of the value being created.
Revenue attribution can be difficult depending on the sales cycle, but even directional tracking helps compare automated and manual leads, campaigns, keywords, posts, and offers.
- Automated leads vs. manual leads
- Campaign A vs. Campaign B
- Different keywords
- Different Instagram posts
- Different offers
Don't Measure Everything
One of the biggest mistakes businesses make is tracking too many metrics. You do not need 30 numbers on a dashboard. Start with the metrics that connect directly to your goal.
For engagement, prioritize trigger rate, response rate, DM reply rate, and engagement. For lead generation, watch trigger rate, DM delivery, click-through rate, and lead capture rate.
For sales, focus on qualified leads, conversion rate, customers generated, and attributed revenue. To reduce support workload, track automation rate, response time, human handoff rate, and resolution rate.
The right metrics depend on what you are trying to achieve.
How Flozari Helps You Track Automation Performance
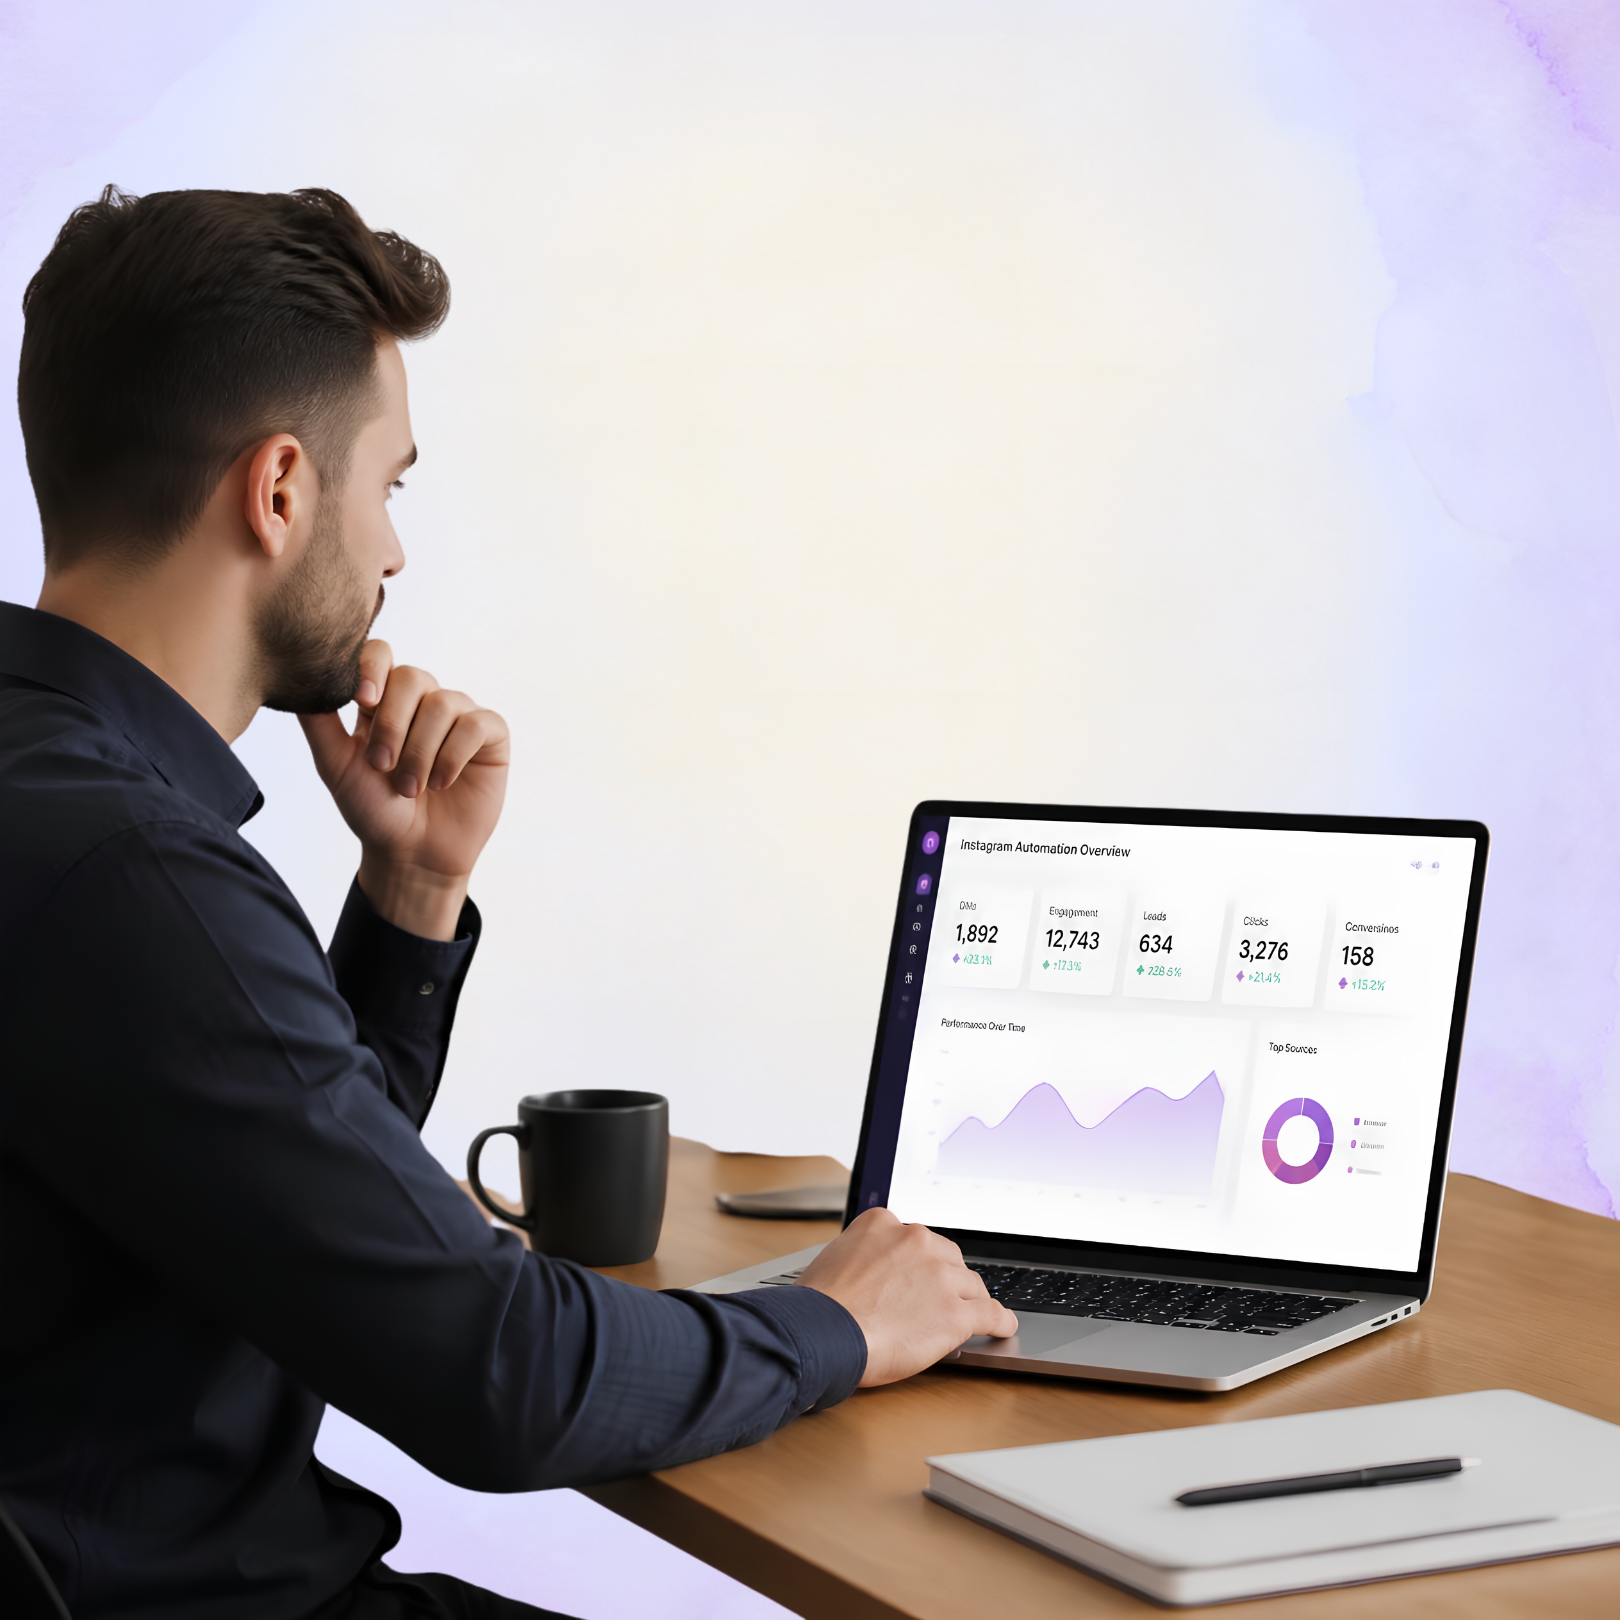
Automation is only useful when you can understand its performance. Flozari's Activity Analytics helps businesses monitor how Instagram automation workflows perform.
Performance data reveals which automations are triggered, which workflows generate engagement, how conversations progress, where human intervention is needed, and which activities contribute to conversions.
This moves the business from “We automated our Instagram” to “We know exactly what our Instagram automation is achieving.”
Turn Metrics Into Action
The most valuable part of analytics is not the dashboard. It is what you do with the information.
High DM delivery with a low response rate means the automation reaches customers, but the message may need improvement. High click-through with low conversion may point to the landing page, offer, pricing, or sales process.
A high human handoff rate may show that common customer questions need better workflows. Analytics should lead to experiments and improvements—not just reports.
The Metrics That Actually Matter
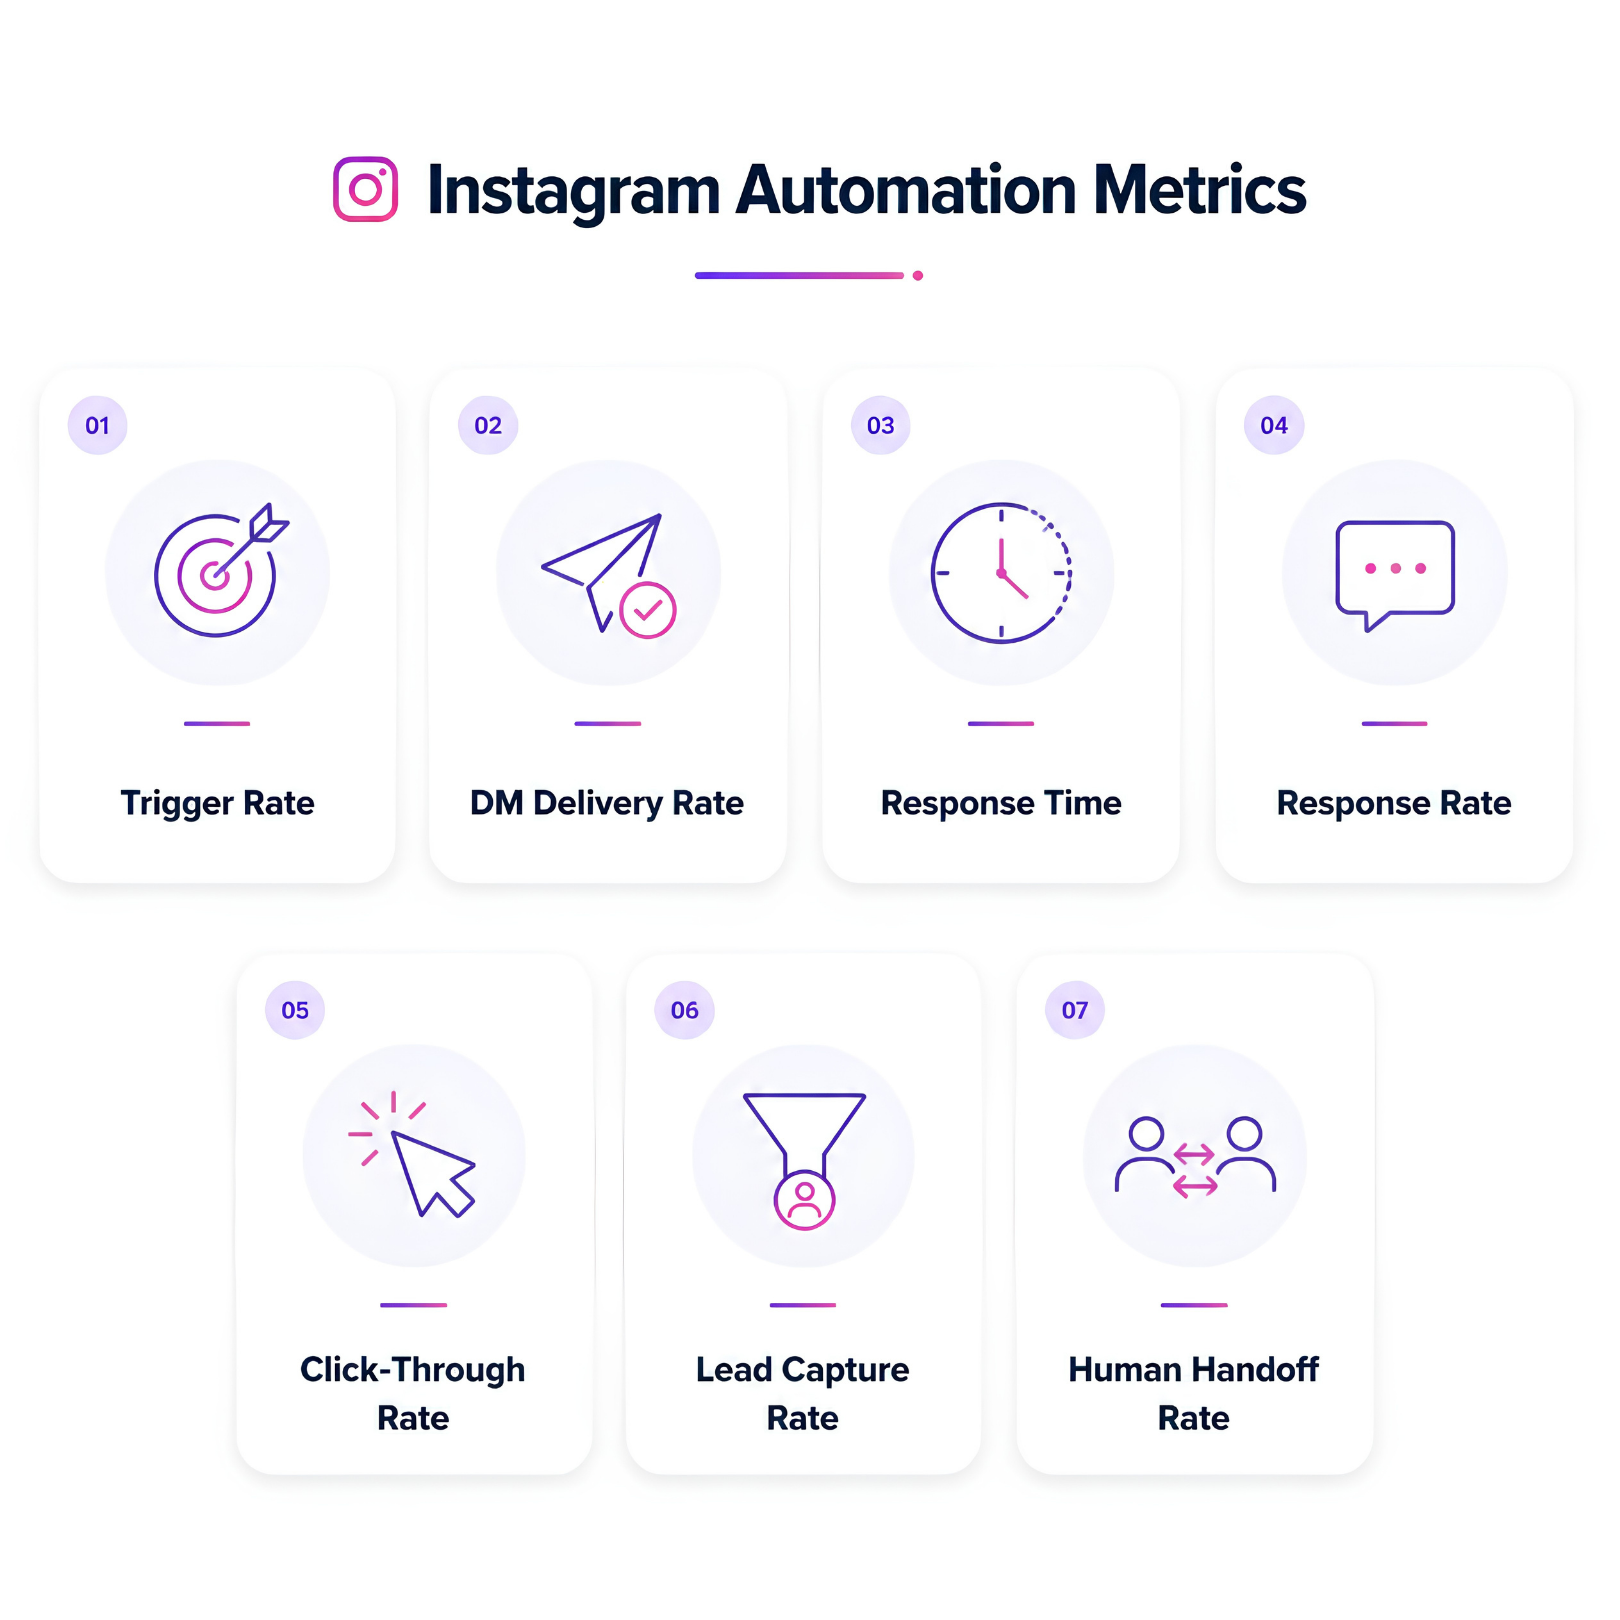
To keep the dashboard simple, start with seven metrics. Add automation-assisted revenue once your tracking setup supports it.
- Trigger Rate: Is automation capturing the intended interactions?
- DM Delivery Rate: Are automated messages reaching customers?
- Response Rate: Are customers continuing the conversation?
- Click-Through Rate: Are customers taking the desired action?
- Lead Capture Rate: Is automation generating qualified opportunities?
- Conversion Rate: Are conversations becoming customers?
- Human Handoff Rate: How much still requires your team?
Final Takeaway
Instagram automation should not be measured by how many messages it sends. It should be measured by what those messages accomplish.
Ask whether response times improved, more customers received answers, conversations increased, more leads were captured, repetitive work decreased, and those conversations generated customers and revenue.
The goal of automation is not to do more. It is to achieve more with less manual effort.
Start with a few meaningful metrics, connect them to business goals, and continuously improve the workflows behind them. That is how Instagram automation becomes a growth system—not just another tool running in the background.
Measure outcomes, not activity.
See what your Instagram automation is achieving—and where to improve it next.
Track smarter with FlozariContinue reading
More Instagram automation guides

7 min read
How Online Stores Can Use Instagram DM Automation to Boost Sales
Read article
5 min read
Your Instagram Comments Are Telling You What to Sell Next
Read article
6 min read